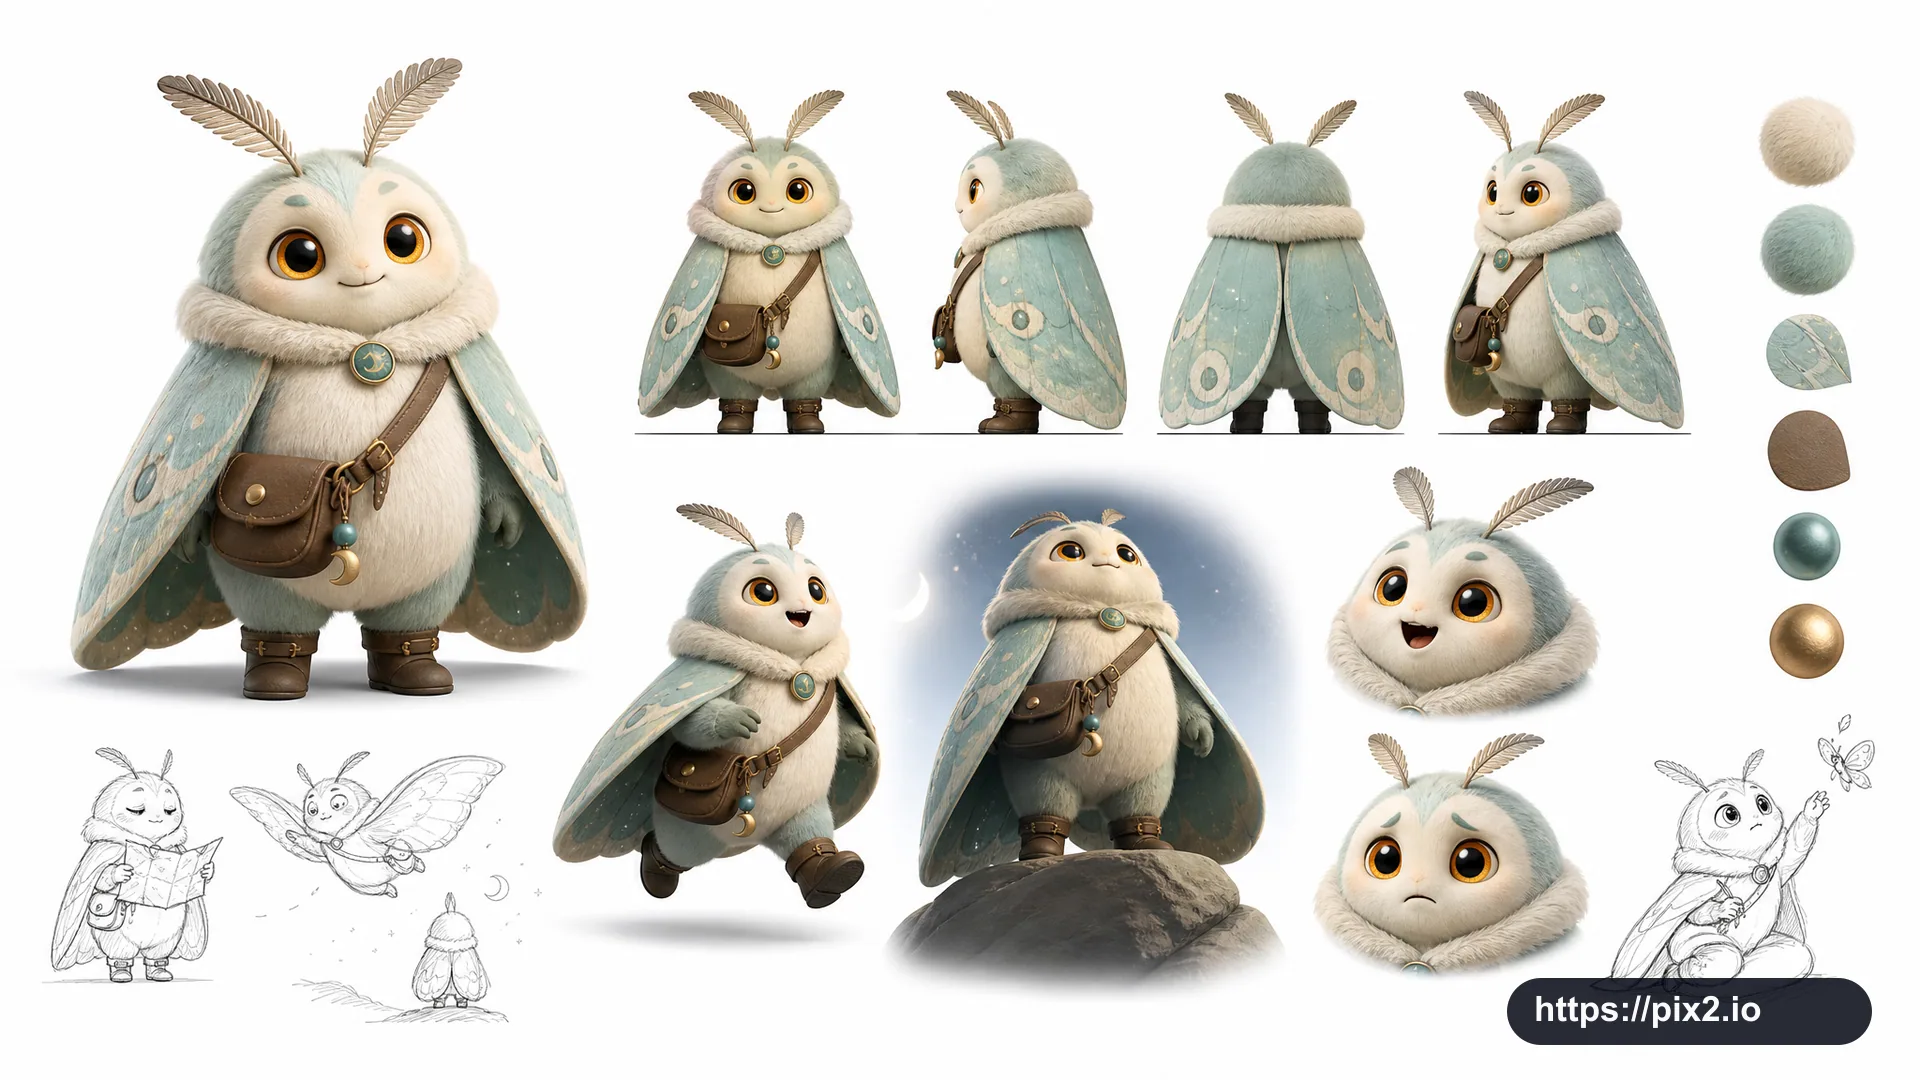
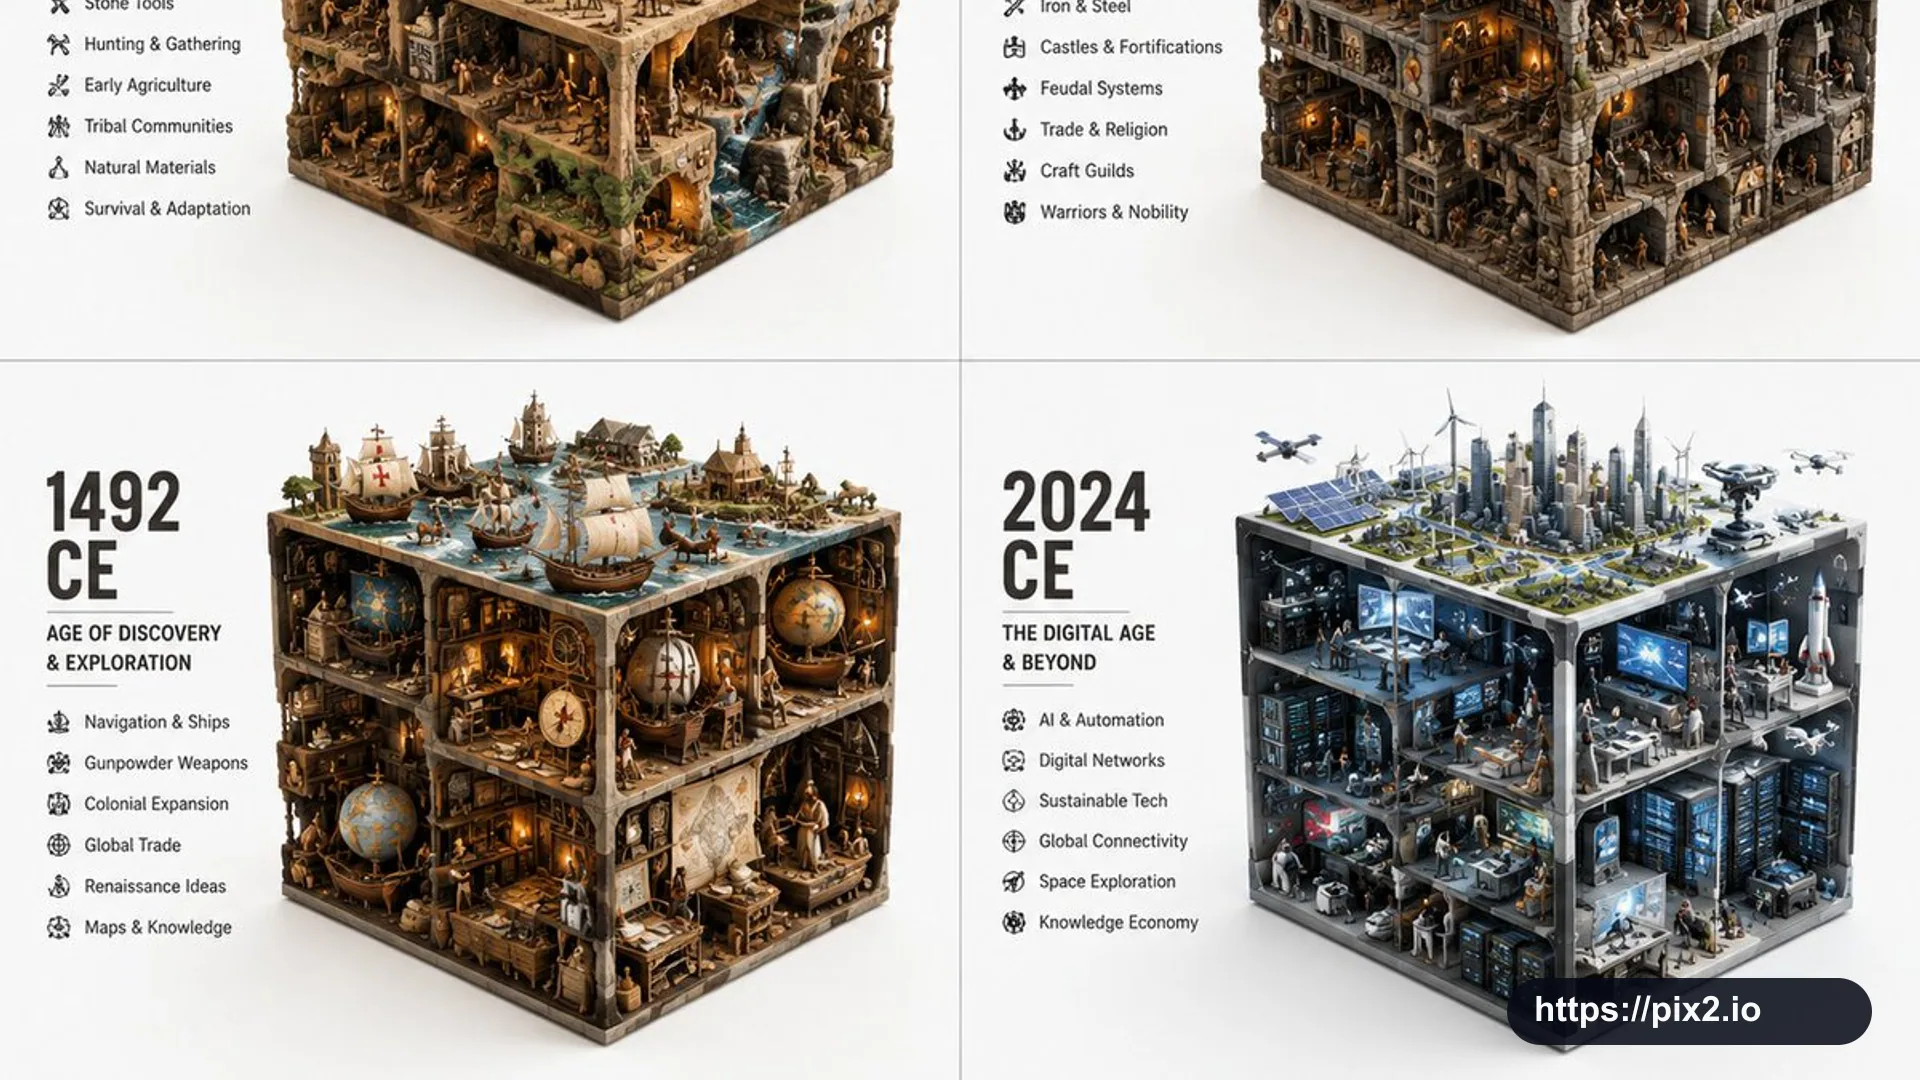
Create a 16:9 educational infographic using a 2x2 grid. For different years or eras of [Topic], run an era-to-cube visualization process.
Input pattern: topic plus era. Step 1, infer era characteristics: time period or phase, dominant materials, key tools or artifacts, social, technical, and cultural context, built or natural environment, and relevant representative agents or people. Step 2, compress the era into a cuboid: large objects define the rectangular volume edges, medium objects build the internal scene, small objects fill gaps, and the top, side, and front faces remain visible. Keep all content inside a strict rectangular volume. Step 3, create modular text: a large era label, a short subtitle, and a concise bullet list. Do not include fixed factual claims unless they are provided or clearly implied by the chosen era. Step 4, repeat across eras while preserving consistent visual grammar, increasing or transforming complexity in chronological order.
Composition: four modular isometric cuboid scenes in a clean 2x2 layout, each with its own year or era label, subtitle, short icon-supported bullet list, and a detailed miniature world inside the cube. Use crisp educational design, consistent spacing, readable labels, high-detail historical miniatures, clean white or neutral background, and enough margin so labels and cubes are not cropped.
Public-template constraints: no real brand logos, no private information, no watermark, no UI chrome, and no unsupported historical claims beyond owner-reviewable educational labels.
 16:9 ・ 4K