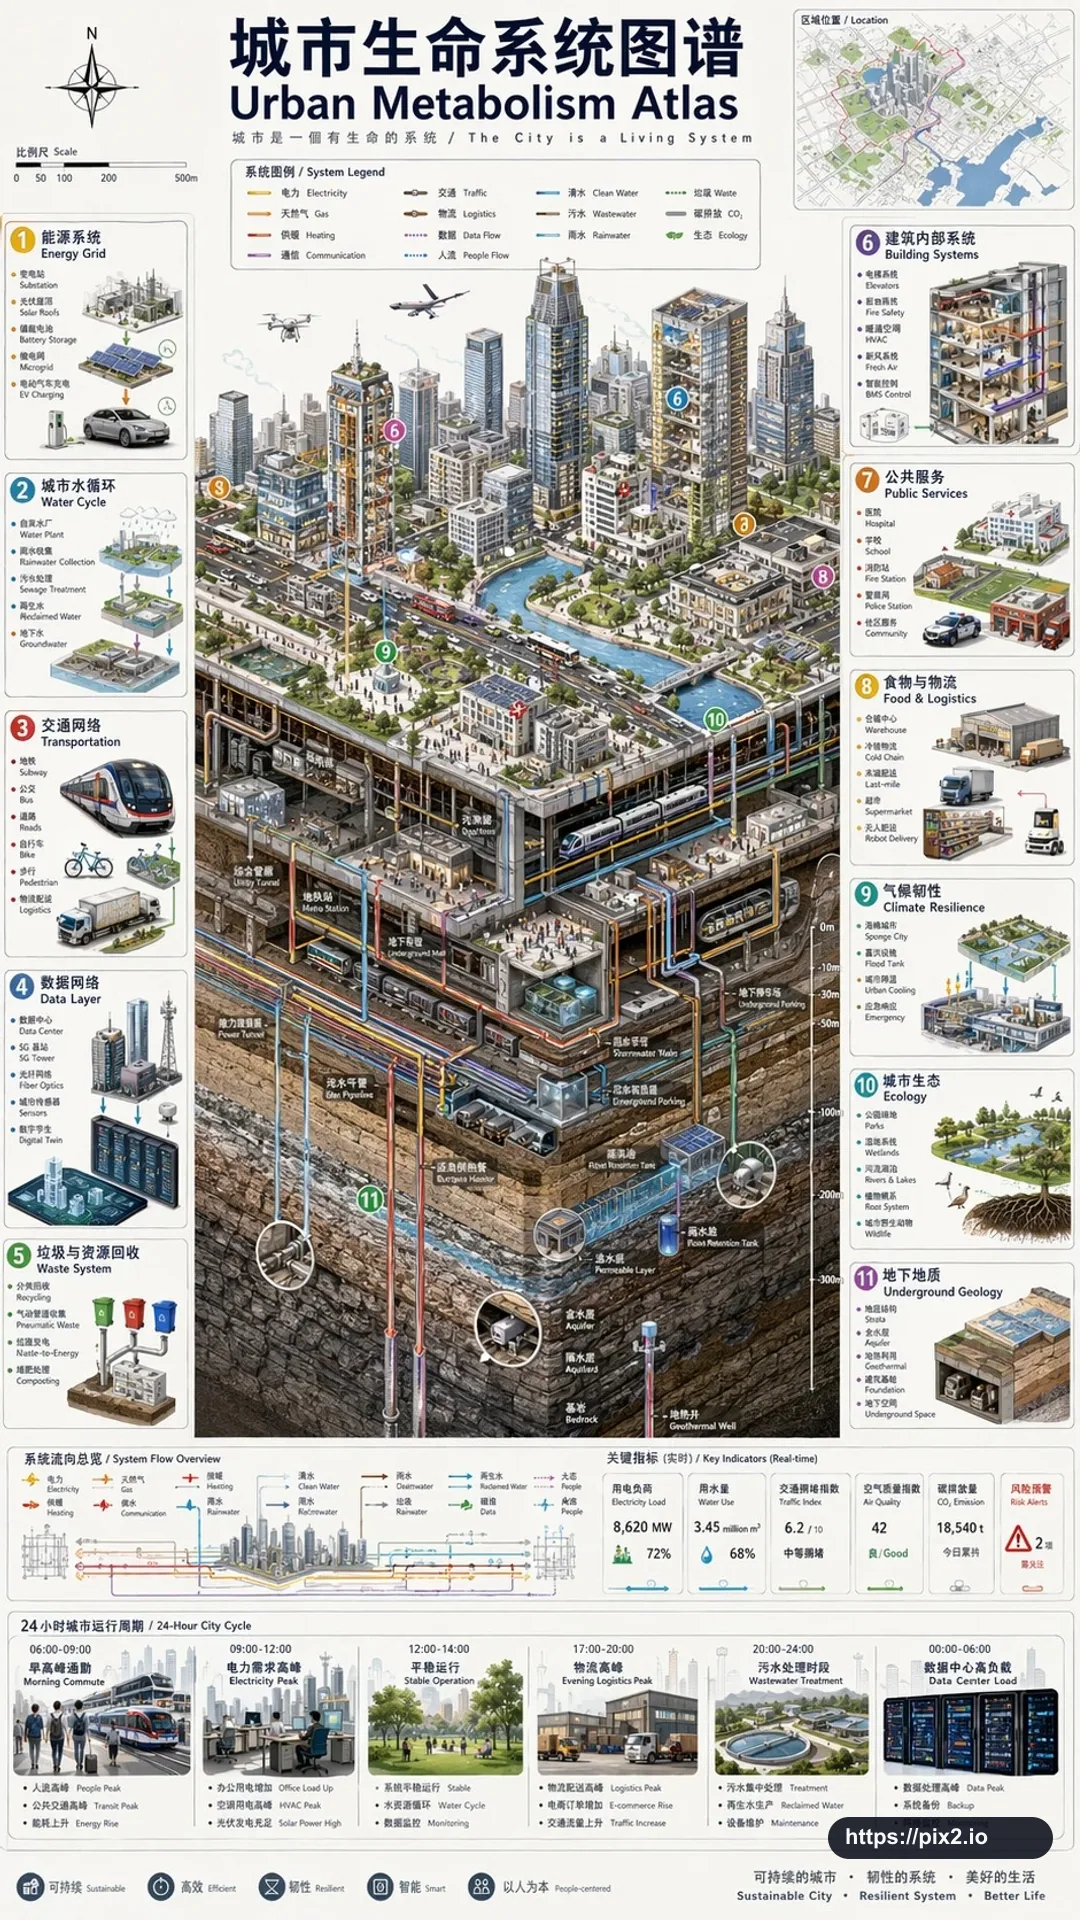
Create a vertical 9:16 isometric cutaway infographic titled "城市生命系统图谱 / Urban Metabolism Atlas". Show a smart city from sky level down to bedrock, including skyscrapers, streets, subway lines, utility tunnels, water pipes, sewage pipes, gas pipes, heating pipes, fiber-optic lines, a data center, flood storage tanks, aquifers, geothermal wells, and bedrock layers.
Use color-coded flows for power, water, data, traffic, and waste. Add 12 numbered side panels with bilingual Chinese/English labels: 能源 / Energy, 水循环 / Water Cycle, 交通 / Transportation, 数据 / Data, 垃圾 / Waste, 建筑 / Buildings, 公共服务 / Public Services, 物流 / Logistics, 气候韧性 / Climate Resilience, 生态 / Ecology, 地质 / Geology, 治理看板 / Governance Dashboard. Include a 24-hour timeline along the bottom.
Style the result as an engineering white paper mixed with a scientific atlas: light paper background, crisp technical lines, fine labels, clean legends, measured diagram spacing, and high-resolution detail. The diagram must clearly show both above-ground and below-ground systems. Avoid cyberpunk styling, gibberish text, missing underground layers, fake brand logos, extra watermarks, unreadable labels, cluttered panel hierarchy, and low-resolution artifacts.
 9:16 ・ 4K